Lighthouse performance is a crucial factor in SEO. That’s why SEO experts worldwide are collectively struggling over their personal and collective battles, which are all being affected by a unified blocker.
But every SEO professional wants a reliable tool for growing faster. Therefore, Google launched the Lighthouse tool in the year 2016. Since its debut, the toll has evolved from a developer-focused tool to the recommended testing tool for the mobile-first index. In contrast, the tool is convenient and straightforward in utilization and its lighthouse performance score matters in SEO. The overall static performance metric is ideal for presentations to senior-level stakeholders.
In general, only metrics contribute to your lighthouse performance score, not the outcomes of opportunities or monitoring. However, improving opportunities and monitoring will likely enhance metric value, so there is an indirect relationship.
This blog post will explain the enhancement of the lighthouse performance score, how it’s calculated, and how lighthouse performance ranks each metric in SEO.
What Is Google Lighthouse?
Lighthouse is a free and open-source website auditing tool. Google created this tool which examines the following aspects of a URL performance, progressive web app, accessibility, best practices, and SEO.
The lighthouse architecture is already used in Google’s other performance measurement tools, such as the analyses for page-speed insights and browser-based audits via the Chrome browser’s developer tool.
Since its launch, we’ve seen three different versions of the Lighthouse performance score tool as follows:
- Lighthouse 1.0 was initially designed as a Progressive Web Apps (PWAs) auditing tool.
- Lighthouse 2.0 added performance and SEO analysis for standard websites.
- Lighthouse 3.0 was released in early 2018 with a new layout and direct integration into Google’s Chrome developer tools. Lighthouse is still an open-source URL-level analysis framework.
How Does The Lighthouse Score Perform?
Lighthouse evaluates how quickly visitors can access or read the content on a website or mobile application. Here are the 6 best practices for lighthouse performance scores:
First Contentful Paint
This indicates how long it takes for viewers to see the initial text or image.
First Meaningful Paint
This denotes the point at which users can see a page’s primary content.
Speed Index
The speed index offers a consistent number to describe how quickly a page’s content loads.
Time Interaction
This shows how long the user must wait before they may engage fully with the page and its contents.
First CPU Idle
The value in this category returns the time when the page’s main thread activity is low enough to allow inputs to be processed.
Estimated Input Latency
The preceding result is an estimate (in milliseconds) of how long an app takes to respond to the user’s input during the 5-second windows of maximum computation during page load. Users may perceive an app or website as too slow if the latency exceeds 50ms.
Role Of Core Web Vitals In Lighthouse Performance
Google launched a chromium project known as core web vitals on the 5th of May 2020. The web vitals metrics are a component of a Google program that aims to offer consistent advice for quality signals to improve lighthouse performance scores.
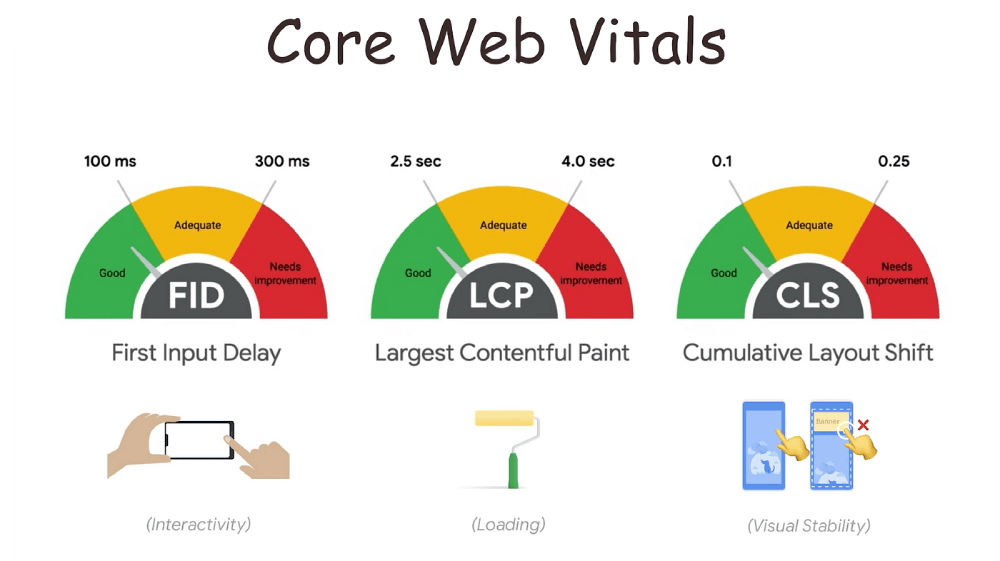
Core web vitals are a cluster of metrics that evaluate the user experience based on factors like load performance, responsiveness to user input, and layout stability. While core web vitals are valuable user experience metrics, they will be meaningless unless you create a development workflow to improve them in both the lab and the field continuously.
The workflow for enhancing core web vitals for your website depends on whether you’re gathering your field data, where you’ll find Google’s tools helpful in identifying and resolving user experience issues.
What Distinguishes Lighthouse From Core Web Vitals?
Lighthouse generates results using simulated lab data, but core web vitals scores are based on user data. Since FID depends on actual user action, it can only be measured using real-world data. The value of FID (First Input Delay) is approximately by Lighthouse using the total blocking time metric. Here are The main notable differences between these two explained below:
- The Google tool Core Web Vitals applies to all web pages and is measured by all the website owners, and it emerged all over Google. Whereas Google Lighthouse score is a tool that aids in improving web quality.
- The Core Web Vital tool displays the performance of a web page based on real-world usage data (field data). In contrast, the Google Lighthouse tool performs some checks and then provides a detailed score and report of how the page performs.
- Core Web Vital can be measured by various tools such as Chrome UX report, Page Speed Insights, Search Console, and Chrome Dev Tools. However, there is no equivalent tool for Google Lighthouse.
- The Core Web Vitals have three metrics:
- Largest Contentful Paint (LCP)
- First Input Display (FCP)
- Cumulative Layout Shift (CLS)
While Google Lighthouse also has three metrics:
- Largest Contentful Paint (LCP)
- Cumulative Layout Shift (CLS)
- Total Blocking Time (TBT)
Why Doesn’t The Crux/search Console Report Not Match Lighthouse?
The Lighthouse performance score doesn’t consider the speed with which a page load is determined by factors such as the user’s network connection, the device’s network processing power, and even the user’s physical distance from the site’s server. Alternatively, this tool emulates a mid-range device and slows down the CPU to recreate common concerns.
The Chrome UX Report API (CrUX API) was designed to provide developers with simple, fast, and comprehensive access to CrUX data. Unlike the existing Page Speed Insights API, which also reports lab data from Lighthouse performance score audits, the CrUX API only reports field user experience data.
How Are Performance Metrics For Lighthouses Calculated?
Using one of four tools, you can calculate a Lighthouse performance score on your site. They all make use of the same KPIs and metrics as those mentioned below:
Web.dev
An easy-to-use application that does the entire score, like performance, accessibility, SEO, and best practices, without not considering the device you are analyzing.
Google Chrome Developers Tool
The most comprehensive tool that examines PWA and all KPIs on desktop and mobile platforms.
Google Page Speed Insights (PSI)
The most widely used tool that analyzes your website’s performance KPI.
GT Metrix
A well-liked performance measurement tool that additionally computes the Lighthouse performance score metrics.
Explaining Lighthouse Performance Metrics
There is one tool, i.e., Largest Contentful Paint (LCP), that builds a platform of lighthouse performance metrics for enhancing the overall website performance. Compared to when the page initially began loading, the LCP Metric shows the render time to the most prominent picture or text block visible within the viewpoint.
What Components Can Be Included In LCP?
There are three major types of components that LCP includes:
- <img> components
- <image>components inside a <svg> component.
- <video> components (the poster image is used)
The components are loaded using the URL() function and have a background image rather than a CSS gradient. Block-level components containing text nodes and other in-line-level text are considered nominal components.
How To Find LCP On Your Site?
LCP is an essential user-focused statistic for measuring perceived load speed since it indicates when the website’s primary content has probably been loaded. A quick LCP gives the user confidence that the page is valuable.
Another way, Google Lighthouse in Chrome Dev Tools offers a different method to find LCP in real. Click the “Generate Report” option under the lighthouse tab. You may find the LCP lighthouse performance score among the other metrics when the test is over.
Why Does Poor LCP Occur?
A poor LCP can occur randomly to reduce the lighthouse performance score, such as built-in media players, widgets like the login form, a newsletter sign-up form that can slowly load a page, slides of wasteful photos, social media buttons, and more.
There are four basic kinds of causes of poor LCP:
Slow Server Response Time
An apparent reason for bad LCP is server response time, which adversely affects all your loading speed measurements. Slow server response times are frequently the consequences of issues with your back-end infrastructure, inefficient database queries, or slow-loading API occurring in your site’s background.
Making sure your website is based on a quality server is the first step in enhancing this.
Render Blocking JavaScript and CSS
Customizing your website is a terrific way to make it stand out, but adding JavaScript and CSS to enhance the theme and content of your site may also slow down the loading time of your website.
To improve your LCP, it can often be wiser to keep a less “heavy” site design and fewer plugins significantly above the page.
Client-Side Rendering
A standard web development technique is client-side rendering, which renders web pages directly in the browser using JavaScript. However, the browser gathers and loads the JavaScript before generating the primary content.
This can be something you want to look at when developing your LCP if you also rely on client-side rendering.
Slow Resource Load Times
Usually, pages with plenty of visual impact or considerable resources will take a long time to load. Your LCP will be impacted if there are numerously slow-loading high-quality photos, GIFs, and text boxes that need to be presented above the fold.
How To Improve Poor LCP?
Poor LCP can be fixed in a few ways, some of which are simpler than others mentioned below:
CSS Optimization
CSS files are resources that restrict rendering from happening. Before the server can render the entire page, resources must be loaded and processed. However, you can optimize CSS files by manually removing unused code, minimizing CSS files in use, or using media queries to optimize CSS background images.
Image Optimization
You may optimize your picture by following a few steps. The following are the key ones:
- Image compression.
- Consider converting your images to better-suited formats.
- Instead of GIFs, use videos that take less time to load.
- Ensure your images have the proper dimensions.
Web Fonts Optimization
Fonts are frequently distributed in large files for optimization. Therefore, text in a rare font will not occur on a page until the font file is loaded. It will take longer for users to see critical information on a webpage, which will not be enough.
To avoid this, optimize your web fonts. The page load should be quicker if you reduce the size of your web font, use a font display, or update your page styling to use your custom font.
Java Script Optimization
It might be worthwhile to check on your JavaScript if it has been idle for some time because it might slow down website load times. Given the most recent LCP stats, a few actions you may do to improve your JavaScript include:
- Deleting Useless Code.
- Ensuring that your code is current and suitable for use with modern browsers.
- Installing current JavaScript and using code splitting to reduce payloads.
How To Use The Lighthouse Score To Test Performance?
Performance testing is frequently carried out in two ways:
- Front End
- Back End
Test the server’s capacity to handle the load when several requests are issued from users at once. Users will receive a terrible 505 error if they cannot do so. Load testing tools such as JMeter, K6, and Gatling can help you redirect how your servers will respond.
Front-End Performance Test
While performing front-end performance testing, servers may return the expected response time, but this does not guarantee that your users will see the response immediately. Performance is also affected by how different browsers process payload data from servers.
JavaScript adds interactivity and functionality to websites but can also add drag, especially if not optimized, and prevents content from being rendered completely. The same case can be said for cascading styling sheets.
Back-End Performance Test
Back-end testing also includes many tools to assist you in testing the performance of your website. Google Lighthouse is one of the most popular tools as it can be utilized as an extension for Cypress, a JavaScript-based end-to-end tool for testing web page performance.
How To Run Lighthouse Tests?
There are the two most suitable platforms to run the lighthouse performance score test. So let’s discover how this combination works for better performance testing.
Run Lighthouse In Chrome Dev Tool
Lighthouse can be accessed directly through Chrome’s Dev Tools. Choose more tools from the main Chrome menu, developer tools, and the audits tab.
Alternatively, you can use the shortcut F12 and select the audits Tab. Select the audits you want Lighthouse to run and click the run audits button. Following that, the lighthouse generates a detailed report on the performance of your website.
Run Lighthouse in Chrome Extension
Install the extension as follows:
- Install Google Chrome on your computer.
- Install the Lighthouse performance score Chrome extension from the Chrome web store.
To run an audit:
- Navigate to the page you like to audit in the Chrome browser.
- Select Lighthouse. It should be located near the Chrome address bar. If not, open Chrome’s main menu and look for it near the top. The lighthouse menu will expand after you click it.
Conclusion
Google values page speed just as much as your users do. Poor page load speed can negatively impact your bounce rate and, to a lesser extent, how you rank organically.
Google Lighthouse assists you in auditing web pages and identifying areas where you can improve page load speed and overall user experience. Combine lighthouse with other Google Devtools or similar site auditing apps to comprehensively review your site’s performance.
Fortunately, Google Lighthouse helps to improve the overall page load speed and overall user experience.

